
TriLinc’s Private Debt Plus strategy is centered on the idea that emerging markets do “represent the biggest growth opportunity in the history of capitalism”1, and providing capital access to growth stage Small and Medium Sized Enterprises “SMEs” in select markets can generate attractive investment return and sustainable economic development.
An important step is identifying the countries that align well with TriLinc’s risk-return objectives for its investors. With more than 120 countries classified by the United Nations as “emerging/developing,” narrowing the universe requires analysis and discipline.
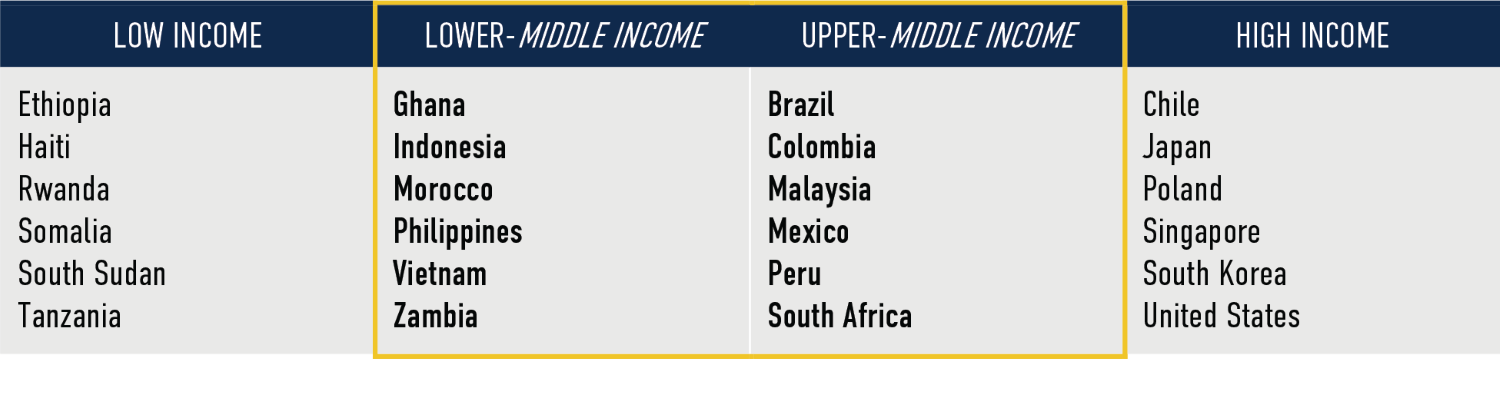
TriLinc’s country selection process starts with a focus on countries identified by the World Bank as Middle Income, where the opportunity for quality investment is significant, competition is limited, and default/bankruptcy is still a reflection of character.
Example of the Countries within World Bank Income Classification2
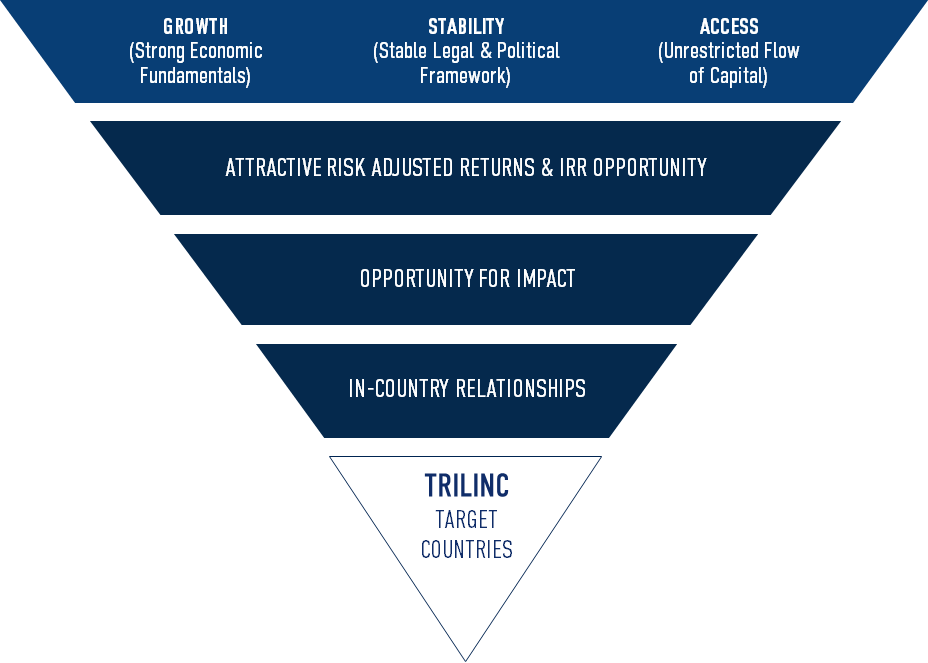
Utilizing our proprietary top-down analytical tool, MAP (Macroeconomic Analysis Platform), our analysis is designed to identify countries with favorable growth fundamentals, legal and political stability, and unrestricted capital access for foreign investors.
Macroeconomic Analysis Platform (MAP)
MAP is a proprietary analytical tool designed to identify countries with favorable growth fundamentals, legal and political stability, and unrestricted capital access for foreign investors. MAP provides fully integrated analysis of key metrics.
• Integrates 30 indicators tracked and reported by institutions like the World Bank, IMF, World Economic Forum
• Summarizes current country macroeconomic conditions and public perceptions
• Our embedded, proprietary composite scoring system quantifies country attractiveness based on Growth, Stability and Access
Growth: Economies with friendly business environments that are experiencing rapid growth
Stability: Countries with consistent political leadership and strong investor rights
Access: Economies where the flow of capital is not significantly restricted
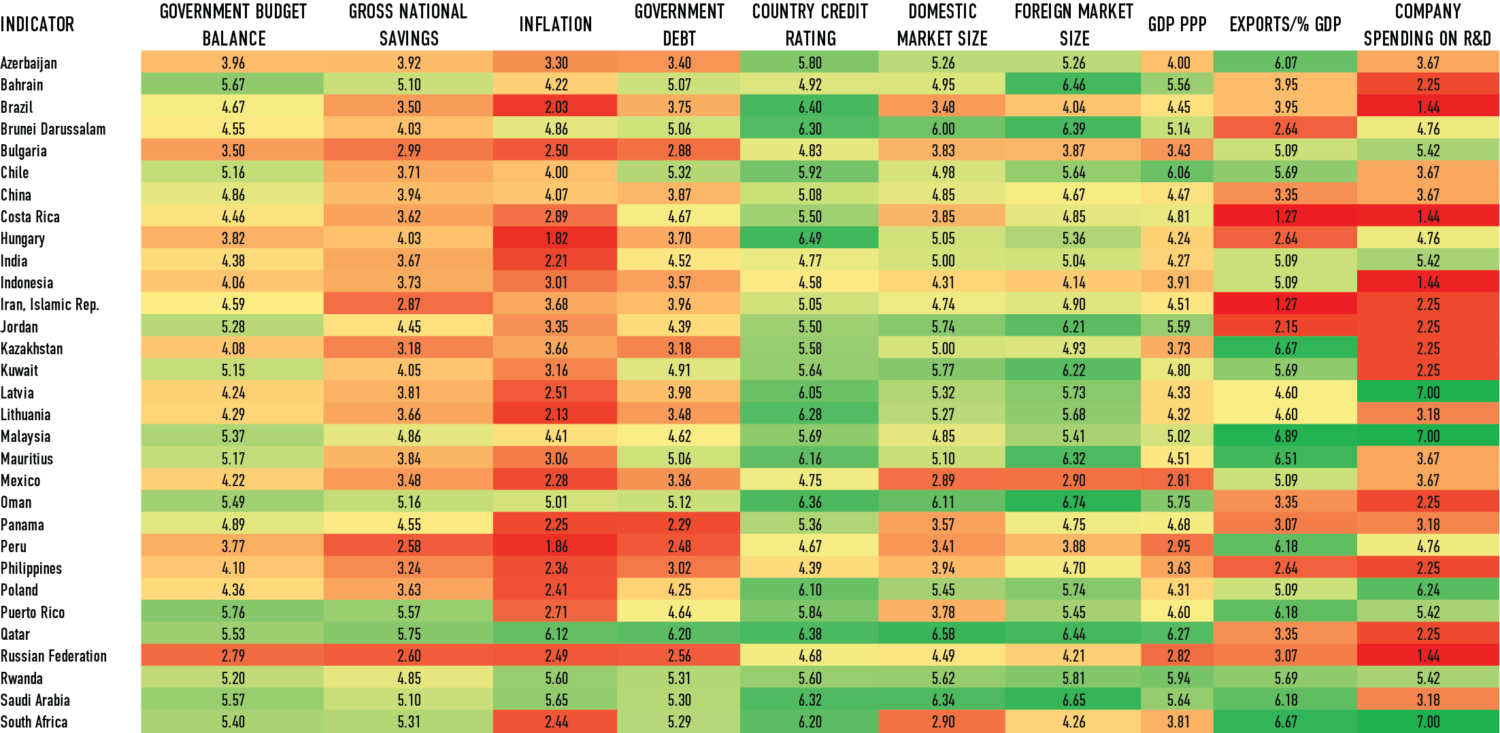
Example of MAP Output3
Country scores are then combined with the top-down analysis of our investment team, and on-the-ground input from our investment partners to identify geographic markets with strong potential for financial, as well as economic, social and/or environmental impact returns.
Investment Partner Selection >
1https://www.mckinsey.com/business-functions/strategy-and-corporate-finance/our-insights/winning-the-30-trillion-decathlon-going-for-gold-in-emerging-markets 2Source: World Bank 2019 Fiscal Year 3The countries shown above is for illustrative purposes only. This is not a complete list of countries evaluated. Countries are given a score from 1-10 based off of 30 growth, stability, and access indicators tracked and reported by institutions like the World Bank, IMF, World Economic Forum. Green cells represent more favorable MAP scores, while red cells represent less favorable scores.