
Borrower Overview
TriLinc has provided financing to an agricultural supplies producer in South Africa. Incorporated in 1999, the borrower produces and distributes specialized fertilizer products that increase efficiency while strengthening sustainable crop growth and enhancing general soil health. The borrower seeks to shift the traditional agricultural productivity paradigm from an increase in quantity of food produced to an increase in quantity and quality of nutritional value. In support of this shift, the borrower has implemented a proprietary technical assistance program for its customers that focuses on a more scientific and biologically sustainable approach to soil utilization. While the borrower’s growth has historically been dependent on competitive pricing, its current expansion is due to an emphasis on superior service and the resulting customer loyalty among its business-to-business and business-to-consumer client base throughout South Africa and the greater Sub-Saharan Africa region. Furthermore, the borrower has a diverse customer base comprised of over 200 local and regional agricultural producers. Secured by specific product inventory, TriLinc’s financing will provide the borrower with short-term liquidity to import supplies for further business expansion, which the borrower anticipates will lead to growth in its employee base.
Market Overview
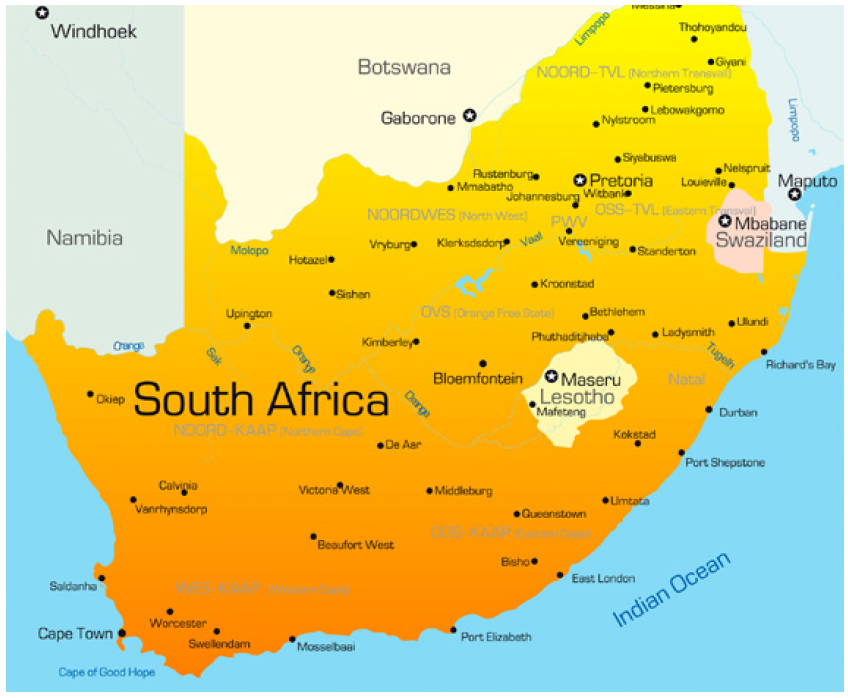
South Africa is classified as an upper-middle income country by the World Bank.1 Between 2010 and 2013, annual GDP growth rates averaged approximately 2.8%.2 South Africa’s main exports have traditionally been concentrated in gold, diamonds, platinum, other metals and minerals, and machinery and equipment.3 Conversely, the country’s main imports have been focused in machinery and equipment, chemicals, petroleum products, scientific instruments, and foodstuffs.3
South Africa meets TriLinc’s country standards for its performance across relvant growth, stability and access metrics.4 In 2014, it ranked second across the Sub-Saharan African region on the World Bank’s Ease of Doing Business index.5 As the second largest economy in Sub-Saharan Africa,6 the country benefitted from the $38.7 billion in net foreign direct investment that was estimated to have flowed into the region in 2013.7 Robust domestic demand across Sub-Saharan Africa helped spur GDP growth to 4.5% in 2014, and is expected to remain stable at 4.6% in 2015.8 Looking ahead, overall regional GDP growth is projected to strengthen to 5.1% by 2017.8
Additional Sustainability & Impact Highlights
-
- The borrower’s technical assistance program aims to improve long-term sustainability through provision of financial management advice and detailed analysis of each participating agricultural producer’s soil, tillage practices, fertilizer, pathogen, pest control policies, residue management techniques, and animal grazing practices.
- The borrower implements enterprise development programs for small and medium-sized enterprises owned by historically disadvantaged ethnic groups. Programs include on-site visits to participant fields and training in best practices for fertilizer and herbicide application, soil and leaf sampling, pest and disease control, and weed identification and control.
- The borrower supports a community center that provides food and assistance to vulnerable and orphaned children and promotes healthy lifestyle habits through its support of local community sports.
- The borrower places special emphasis on education and provides scholarship funding to students at a local agricultural technical college. It also contributes to a national educational trust that benefits disadvantaged children, particularly in rural areas.
1The World Bank, Doing Business 2014, Economy Profile: South Africa. 2The World Bank, World Development Indicators Database, 2014. 3CIA, The World Factbook, 2014: South Africa. 4There is no assurance that our investment in this company or this market will be successful. 5The World Bank, Doing Business 2015, Going Beyond Efficiency. 6The World Bank, World Development Indicators Database, 2014. 7The World Bank, Data, 2015. 8The World Bank, Global Economic Prospects, 2015.
The above information is as of the initial date of investment: October 15, 2014.
This borrower is no longer a TriLinc fund investment.
TriLinc originally performed an SDG mapping exercise in December 2017 to map all of our borrower companies, both current and exited from our portfolios, to specific SDGs based off of business activity. TriLinc’s official SDG alignment methodology was not finalized until June 30, 2018. For borrowers that had exited TriLinc’s portfolios prior to this time period, the selected SDGs for these borrower are a reflection of what TriLinc believes would have been the SDG alignment if 1) the SDGs had been in effect and 2) TriLinc had integrated the SDG alignment while the company was in the portfolio. The SDG mapping presented does not include input from Investment Partners or borrower companies given that the companies were no longer in the portfolio when the alignment was finalized.
An investment with TriLinc carries significant fees and charges that will have an impact on investment returns. Information regarding the terms of the investment is available by contacting TriLinc. This is a speculative security and, as such, involves a high degree of risk. Investments are not bank guaranteed, not FDIC insured and may lose value or total value. Some investments may have been made in an investment vehicle that is no longer open for investment. The highlighted investment may or may not have been profitable. There is no guarantee that future investments will be similar.
Want to learn more? Contact Us.